Geofactery from TidyAnalytics delivers:
timely, quality, affordable
geo-demographic data and modeling tools for your strategic initiatives
Available now:

Housing Growth in Nashville
Coming Soon:
(Complete roadmap here)
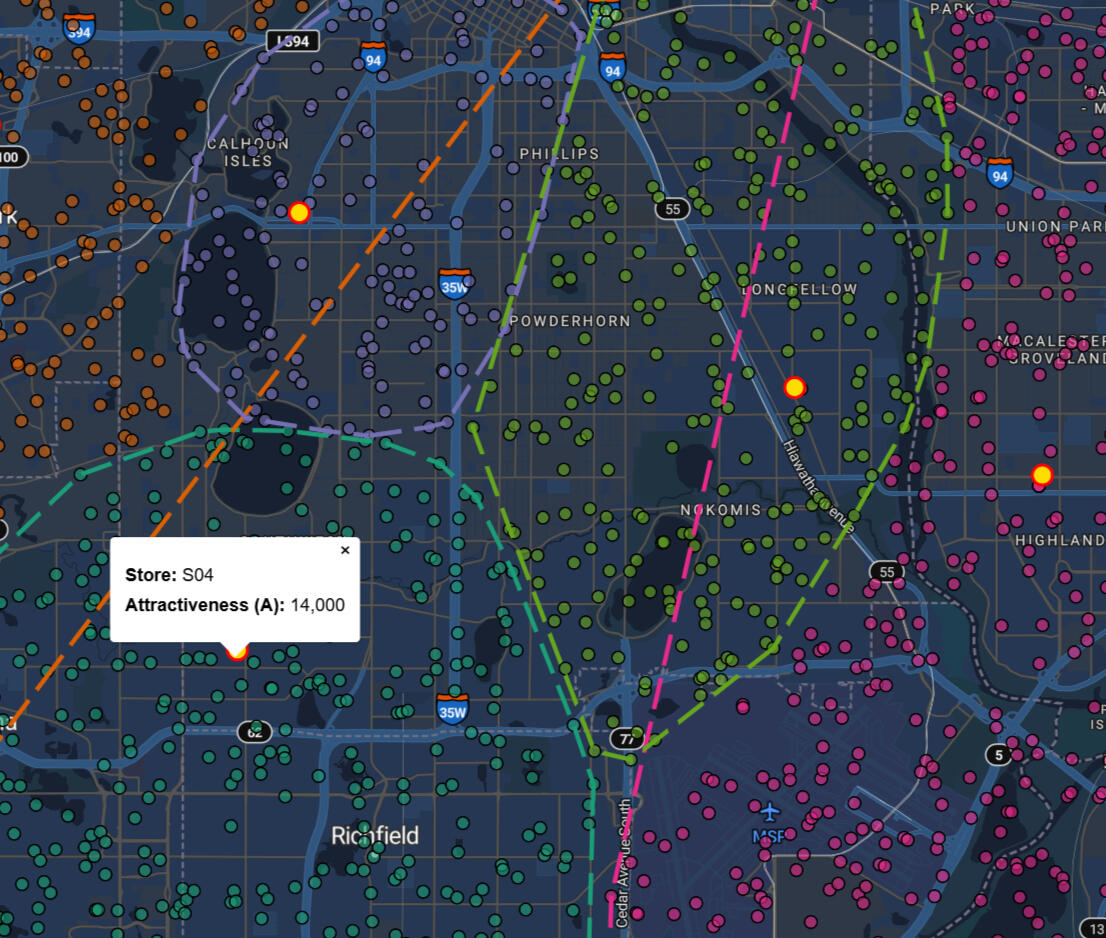
Map-based analysis app for modeling market coverage and competition within a metro market; 'what-if' analysis and scenario-construction (eg: "what happens if we add a 10,000 sf location here?")
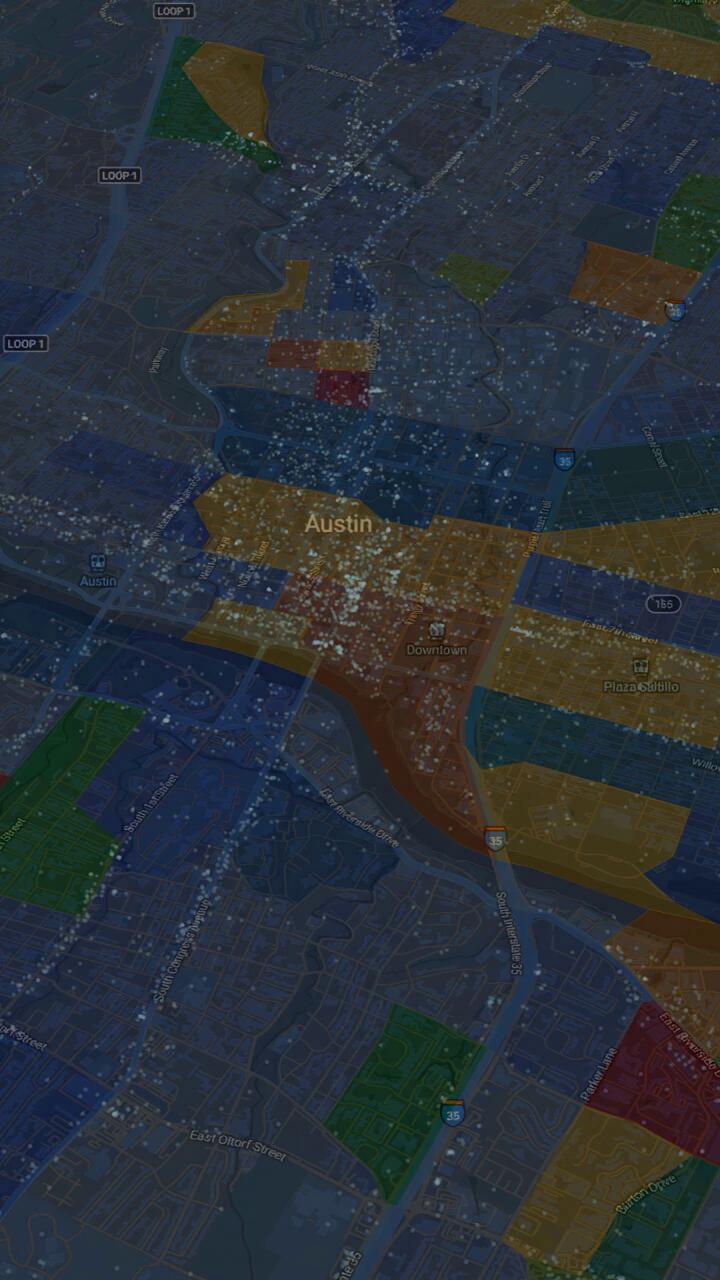
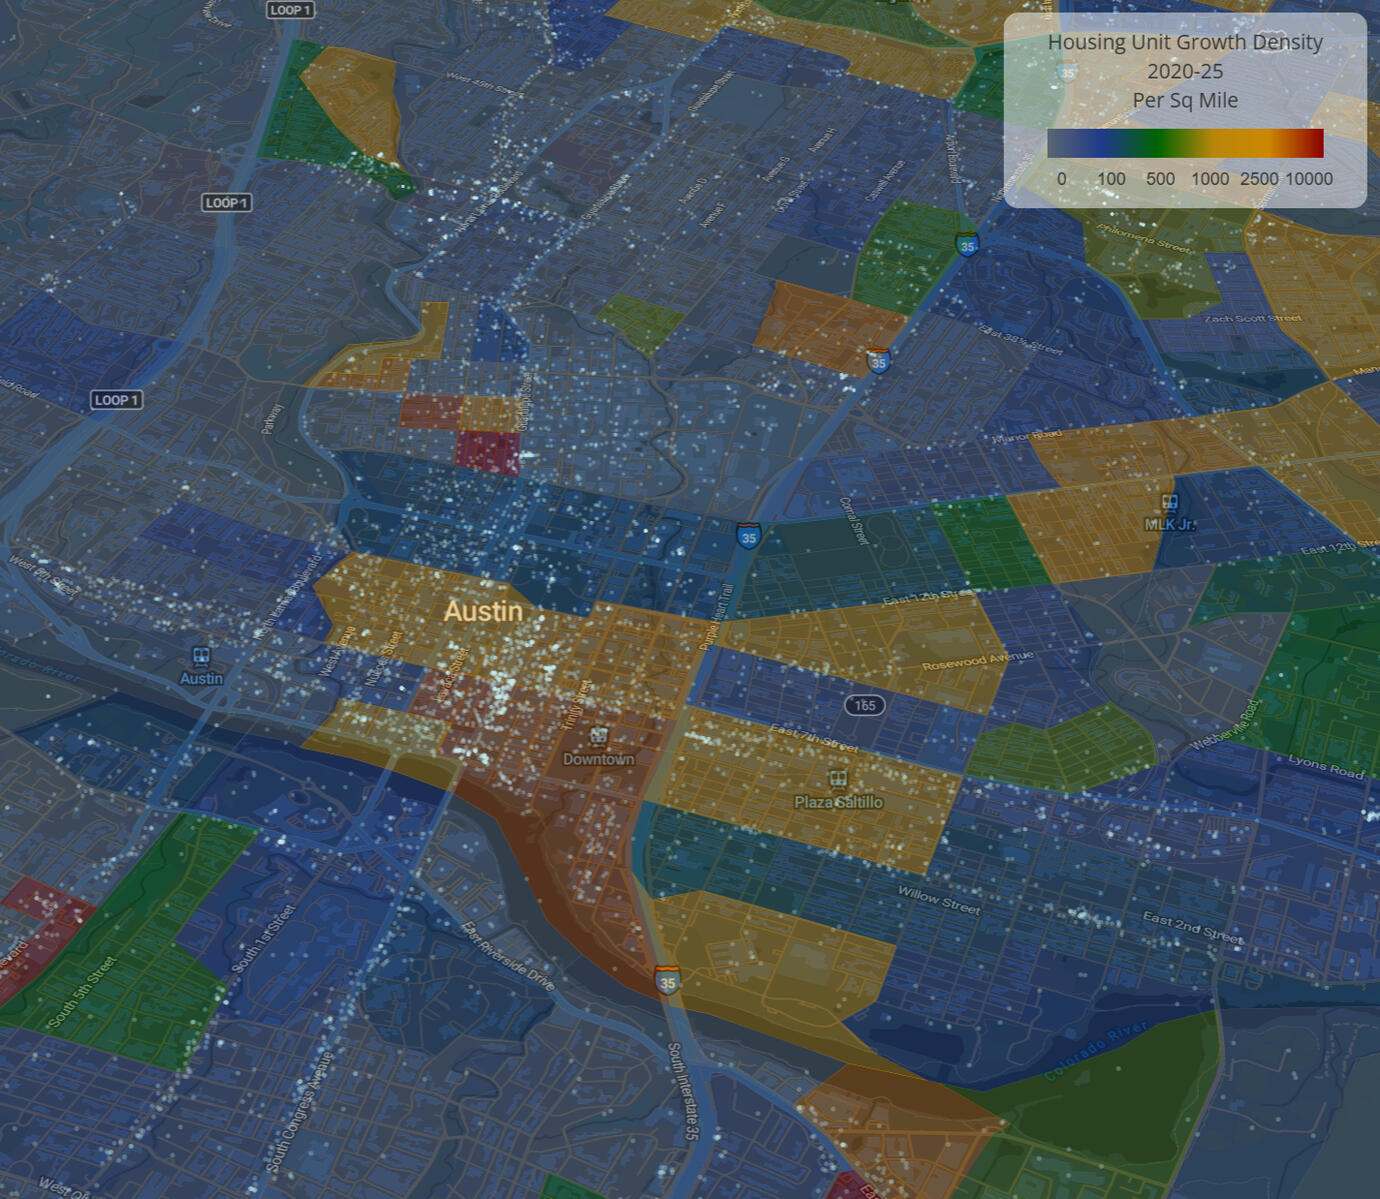
There are few issues more pressing and in-the-news these days than US housing. To aid informed decision making for all, we are offering free access to our housing growth map.
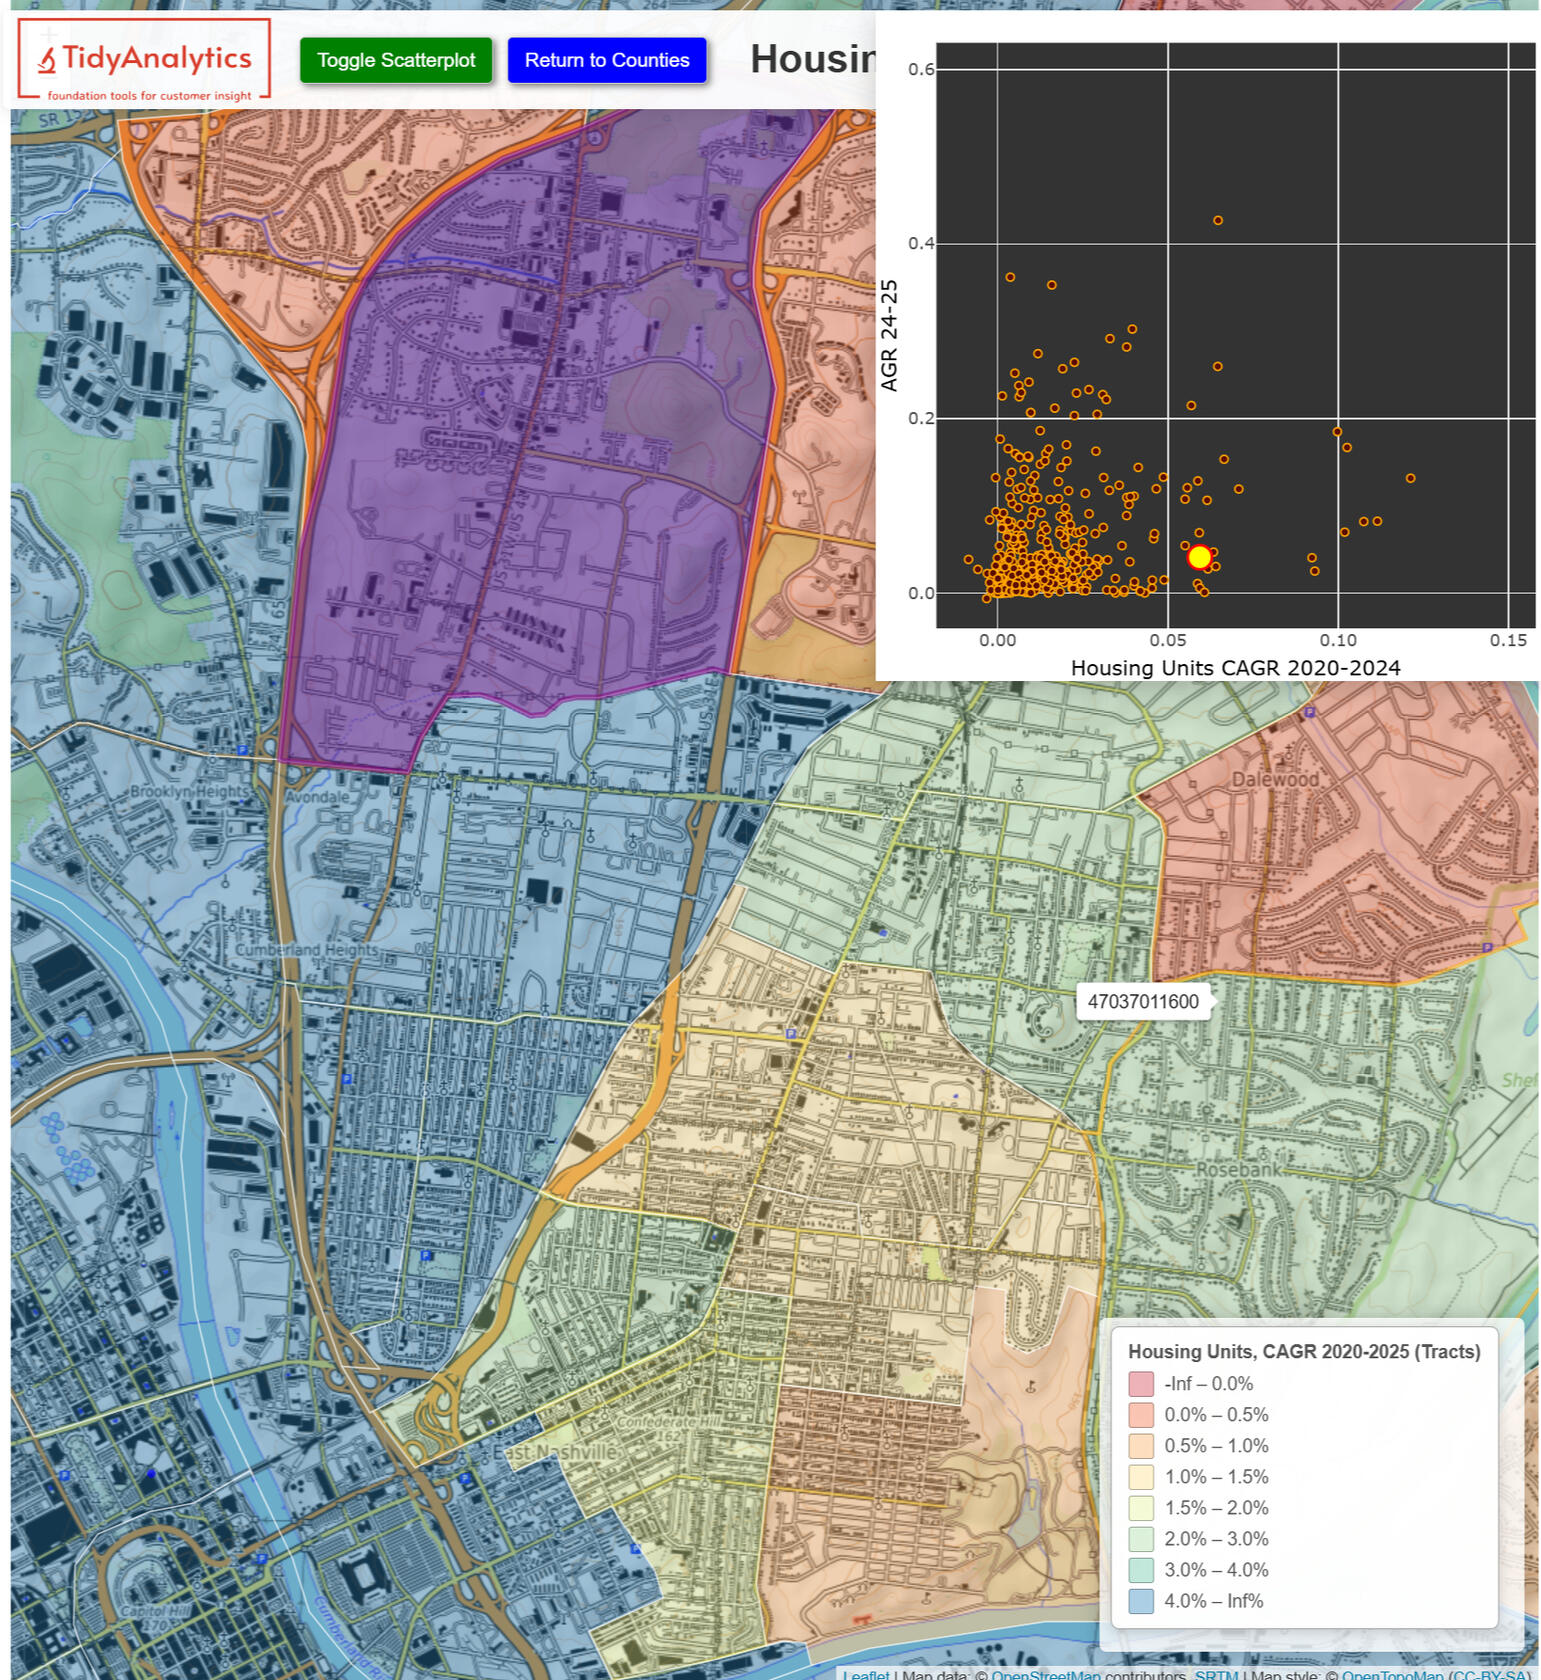
The growth map contains data for counties, with drill down to neighborhood block groups for more detailed review, as well a collapsible companion scatterplot showing the growth rate for selected geographies in context.Note: this data has just been updated with data through July 2025, and represents the most up-to-date comprehensive data you are likely to find on what is happening with residential growth in the US (at least without spending a fortune....)
TidyAnalytics is committed to keeping both the data and accompanying map analytics products up to date, and will issue updates in close sync with Census Bureau data releases. We run a lean data operation, and you can expect updates to flow to you within 7-14 days after the Census Bureau releases its updates
Note that the free map product does not provide download access; if you are interested in comprehensive growth data for internal use, you will want to check out our BuildingZones product, which provides the data underlying this map in much more detail, along with comparative indexes, here

Housing Growth 2020-2024 for Minneapolis Census Tracts

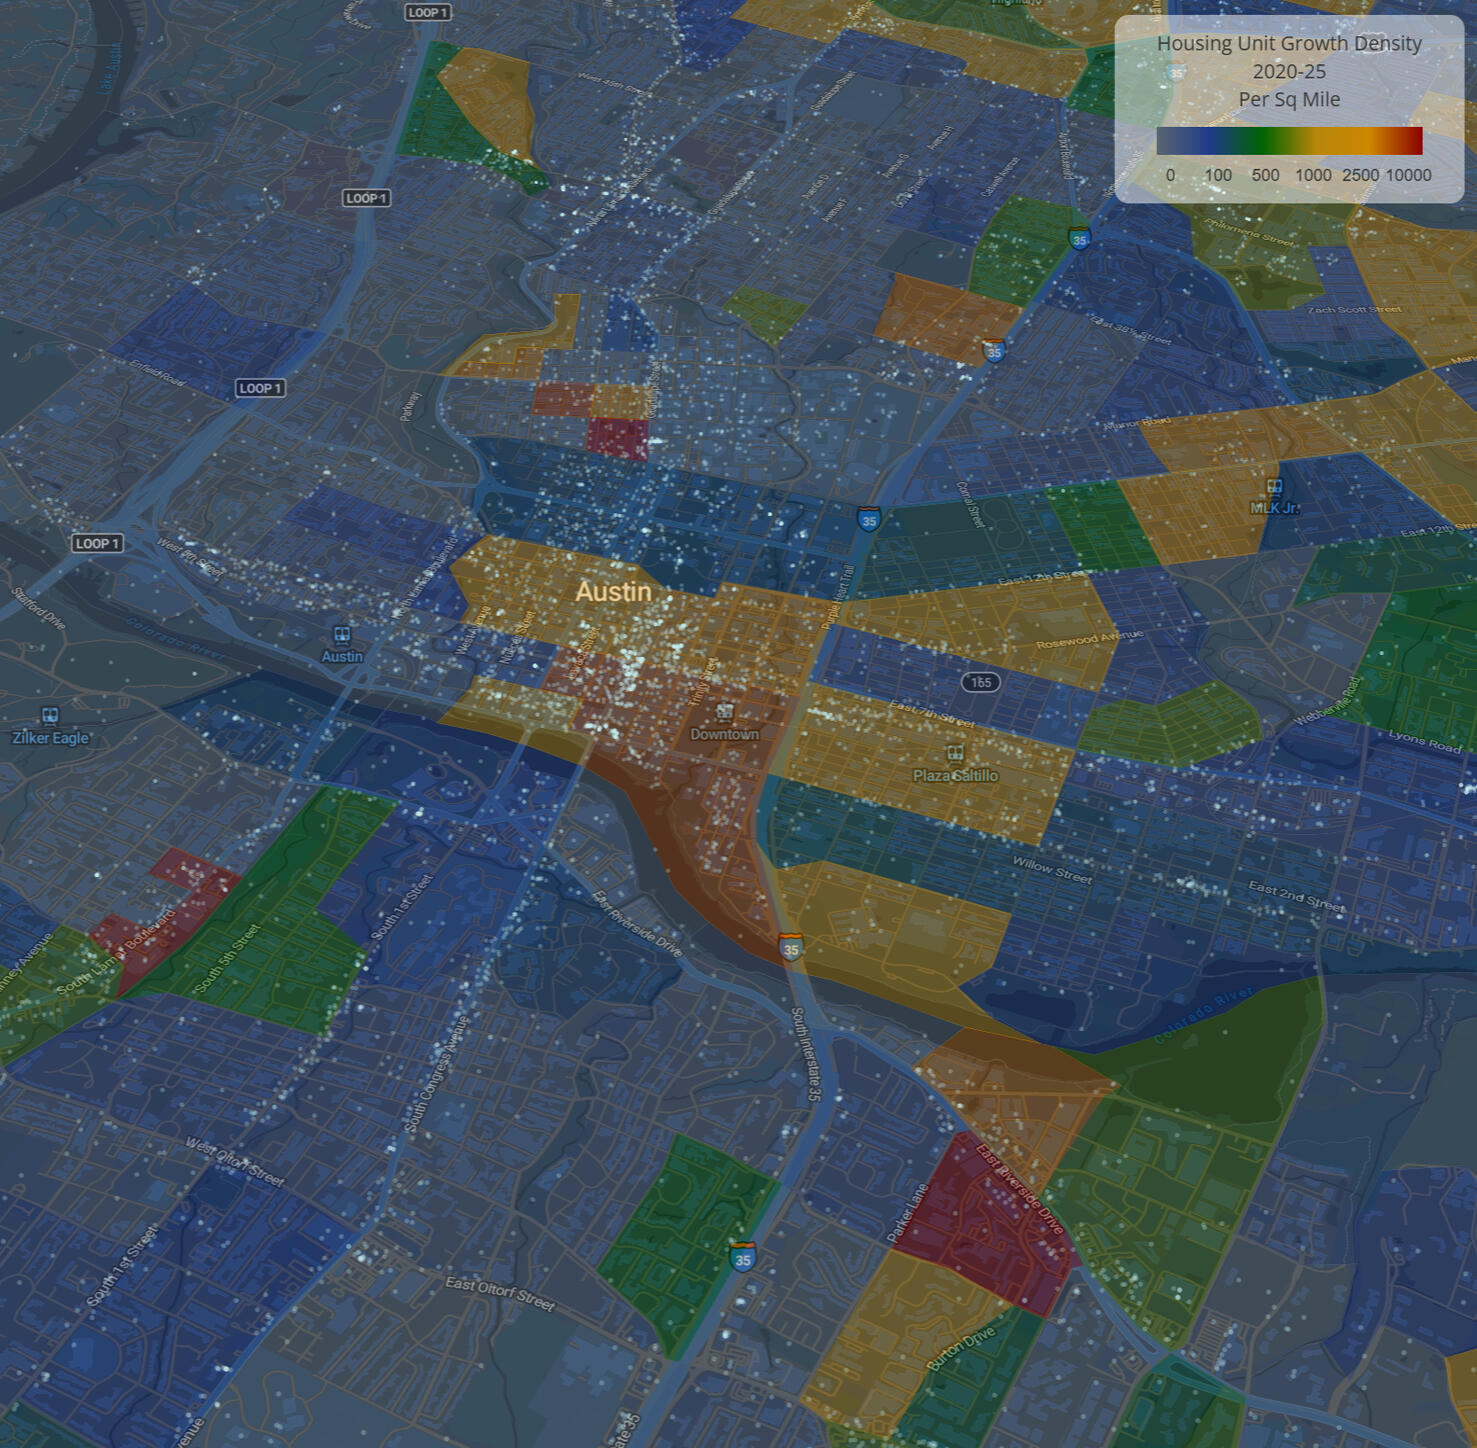
Where housing in the US is being added, and where it is not.UPDATED THROUGH NOVEMBER 2025Total units, growth in total units, with comparative indexes and percentiles, for multiple geographies, 2020-2025. Includes metrics for both the total April 2020-November 2025 post-Census period, as well as breakouts for shorter windows within the period, for customized growth trajectory analyses.
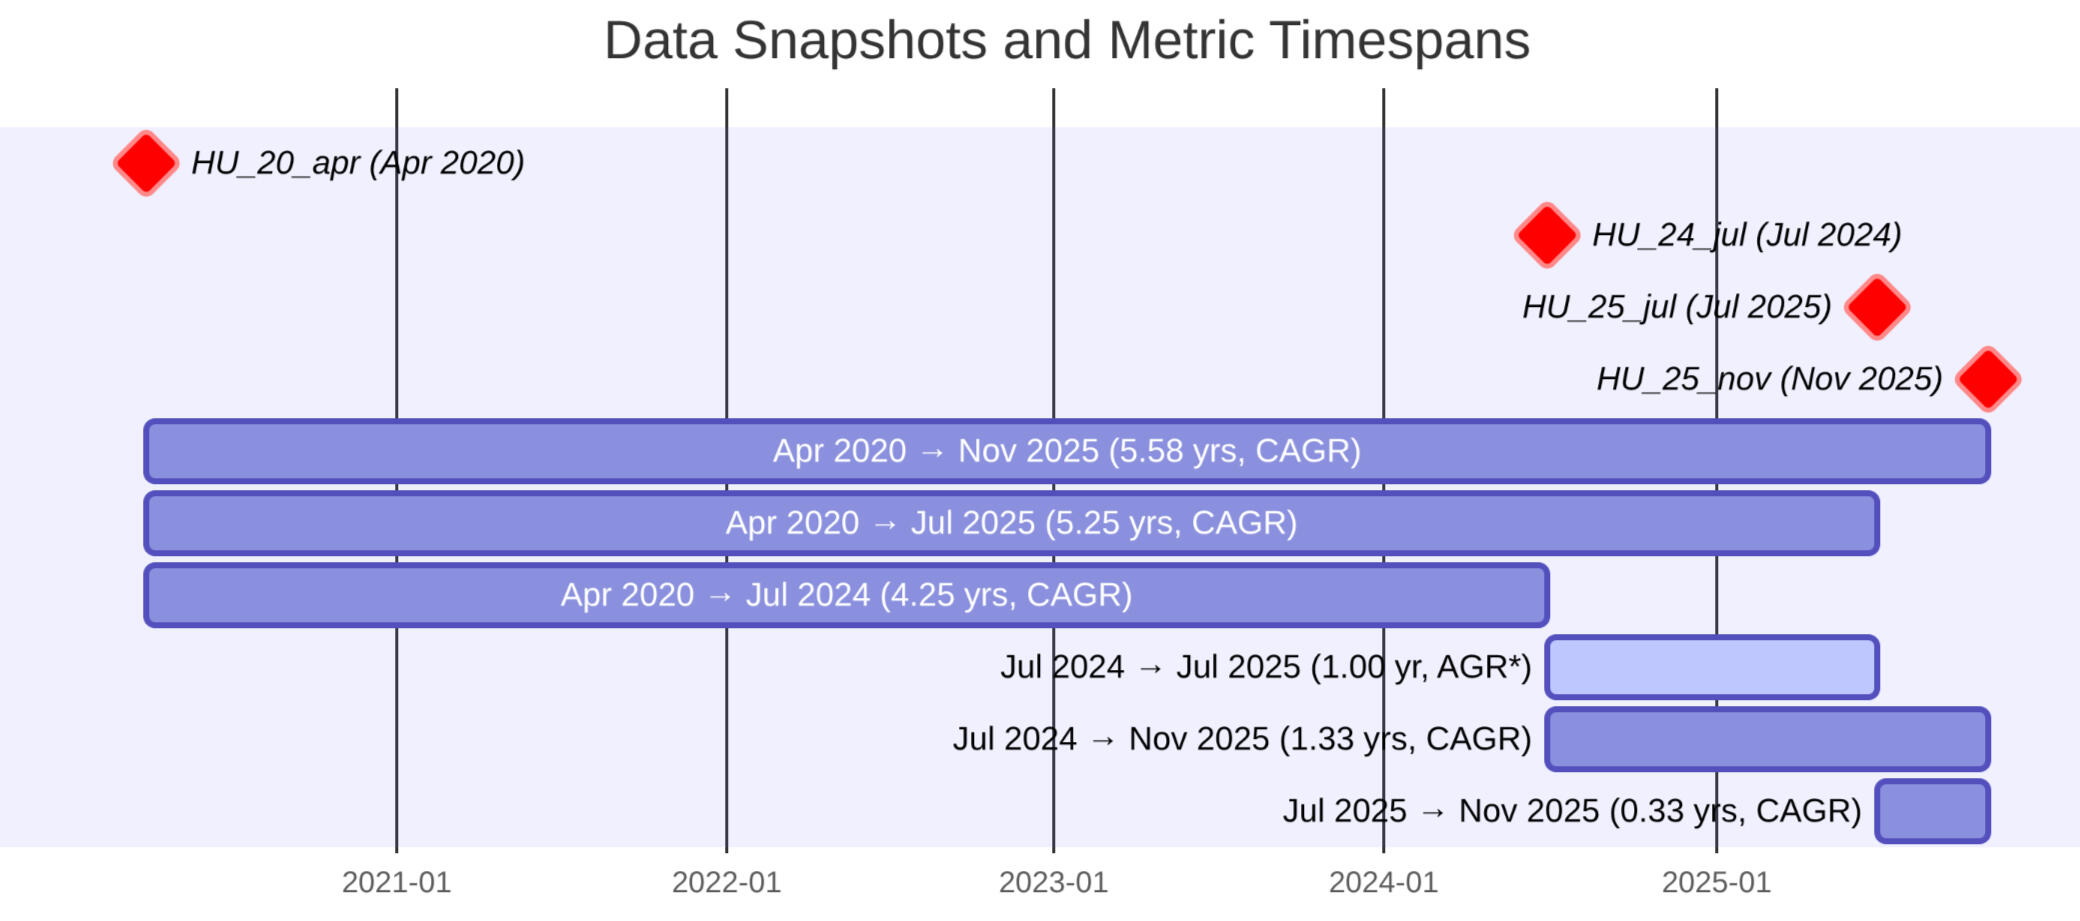
Measures
- Total Units
- Change in Units
- Growth Index, Absolute
- Compound Annual Growth RateComparative Indexes:Block Group versus: County, Metro, State, US
Census Tract versus: County, Metro, State, US
ZCTA versus: State, US
County versus: US
Place versus: State, US
County Subdivision versus: State, US
Urban Area versus: USPlus:National Percentiles (1-100) for all geographies below state levelGeographies:
Block | Block Group | Census Tract
County | State | US
ZCTA | Place | County Subdivision |
Urban AreaData is provided in CSV, Parquet, and DuckDB formatsAlso includes a customizable analytical website containing maps and plots for exploration of the underlying data
Updates: customers automatically receive access to any updates released within 1 year of original purchase; after one year, updates are available to repeat customers for 50% of the base price in effect at the time of the update purchase(Discounts are available for qualified organizations -- for more information click here)
Well crafted visualizations help people understand comparative information much quicker than text alone, and research shows that visual information is retained better over time. Help your users fight cognitive complexity with a TidyAnalytics Demographic Insights subscription.
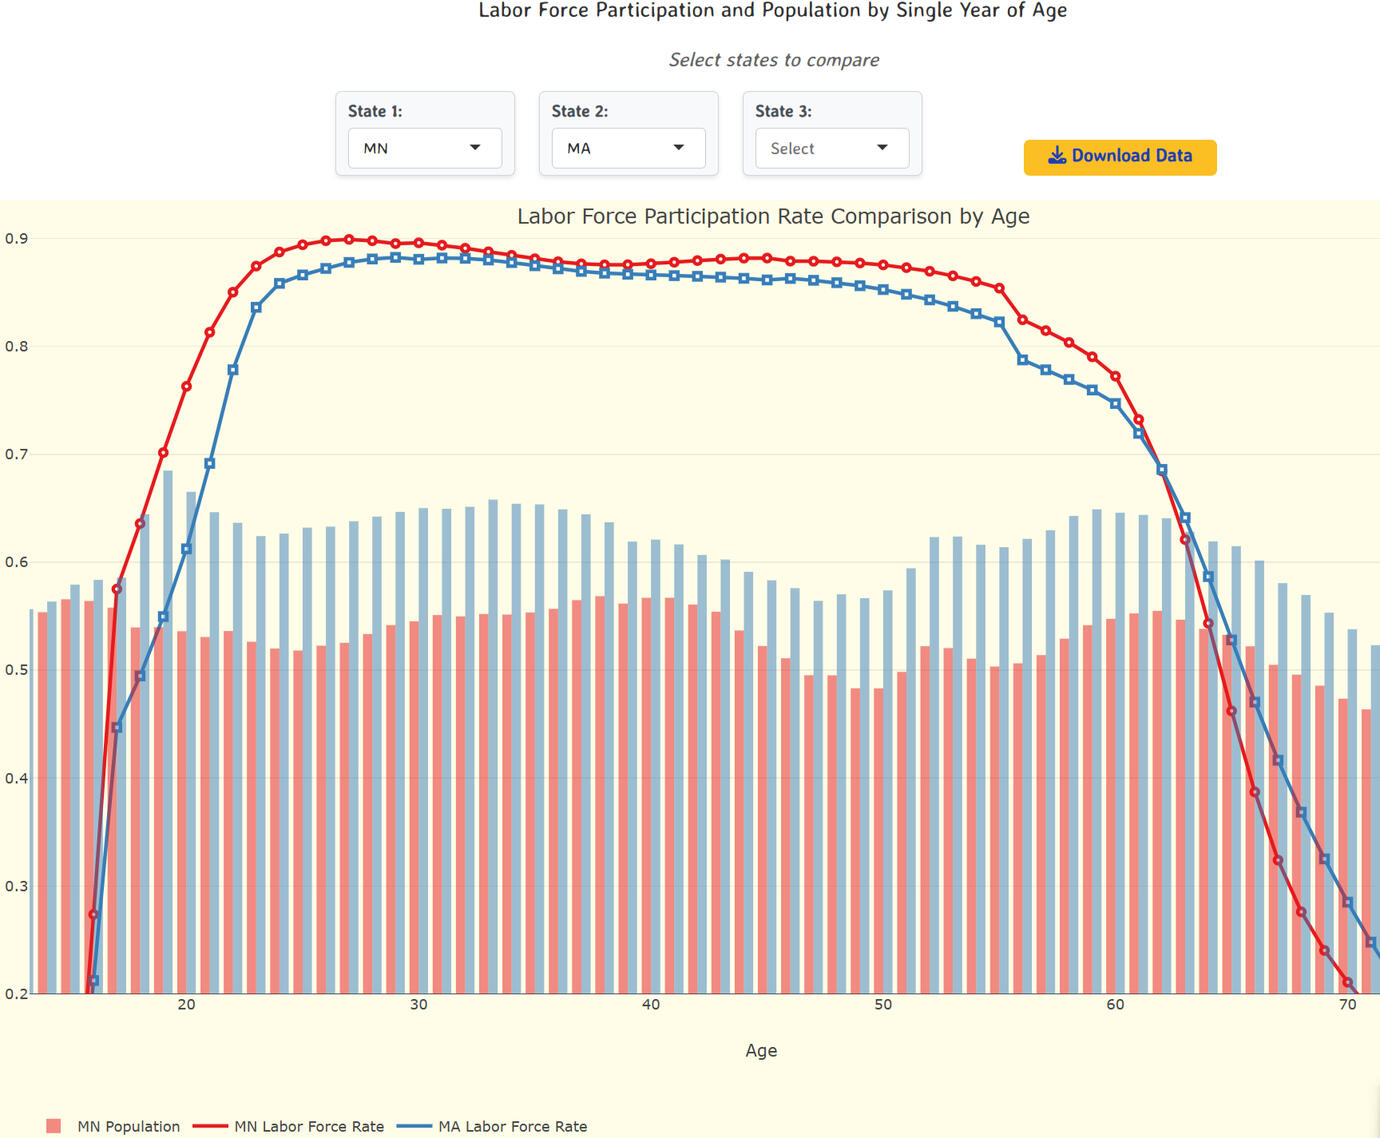
No data fluff here: our topics drill into US geo-demographic fundamentals, in an easy to use, visual way:- Housing supply, housing unit growth- Detailed age: by detailed geography, change in distribution through time- Workforce participation: by detailed age, by detailed age and geography (coming 2q 2026)- US migration patterns and trends- Travel congestion and logistics
More to come...All our data is built from scratch, never re-licensed from other providers, from primary source data.Selected dashboards also enable download of summarized scenario data for use in Excel, etc.We will be introducing a greatly enhanced map visualization experience in early 2026 with new cloud-based map technology that allows a much more immersive experience, as well as a greatly expanded list of available demographic and economic measures, with user-selection of available measures
Check out a preview of the updated experience here
(NOTE: please allow about 30-45 seconds for the app to 'wake-up'; the wait is worth it!)We will be either adding a new visualization, or expanding the data available in existing visualizations twice a month during 2026, so this is a subscription that will continue to increase in value as time goes on
***Please note that Version 1 of the housing growth map will remain free to all users; you can access this free version by visiting this page
(Further discounts are available for qualified organizations -- for more information click here)
Hey there data explorer:
you can find our US housing growth map at:housing.tidyanalytics.comBut before you click that link, see below for a quick video to get you going.The app is designed to be self explanatory, but a quick orientation will likely be useful:- Use the "+" and "-" buttons in the upper left to zoom in/out, or, alternately:double-click to zoom-in
<shift>-double-click to zoom out- Click to select counties; then click the 'show-block-groups' button to zoom in at a granular neighborhood level for counties in the regionRegion counties: defined as neighboring counties PLUS the neighbors of neighboring counties; when you drill down to block group level and review the scatter-plot, you will be viewing data points for block groups in the region defined by the union of those countiesUse the 'toggle scatterplot' button to open/close an XY plot of housing growth rates:- the X axis represents the period 2020-2024the Y axis represents the most recent 1 year growth (2024-25), to aid in assessing growth trajectory- The map and scatterplot are linked; selecting a geography highlights the respective scatter-point, and vice-versa; selecting points at the extremities of the plot (high growth rates) zooms and highlights the map for the selected geographies, showing where the highest growth geo-units are located
TidyAnalytics offers a standard discount of 40% on all primary data products available via our Geofactery.us portal to partner agencies, consultants, and system integrators who are bundling solutions for other organizations; this discount is also available to qualified non-profit and charitable organizations who will be using the data internallyThese are not easy times organizations in the non-profit and charitable sector; if you know of a deserving data-driven organization that can make use of a high quality provider of demographics, a Demographic Insights subscription is an ideal gesture; an annual subscription to our data visualization apps is only $325 with the 40% applied discount; the recipient organization will be provisioned with up to 5 user accountsJust click the button below and tell us a little bit about your internal or beneficiary organization and use-case in the 'Request' section, and if your organization qualifies we'll get right back to you with a discount code that can be applied at checkout
If you are interested in a comprehensive license to all data produced by TidyAnalytics, you can find more information at the following page:
TidyAnalytics Omnibus Subscription
Where housing in the US is being added;
housing unit growth 2020-2025, for multiple geographies.
UPDATED THROUGH November 2025
More Info...
Fast visual insights for key US demographic and economic indicators, in low-complexity, easy-to-navigate web apps.


More Info...
Where housing in the US is being added;
housing unit growth 2020-2025, for multiple geographies.
UPDATED THROUGH JULY 2025
More Info...